
Whatcom Transit Authority Is Losing Riders: What Could We Learn From Kingston, Ontario?
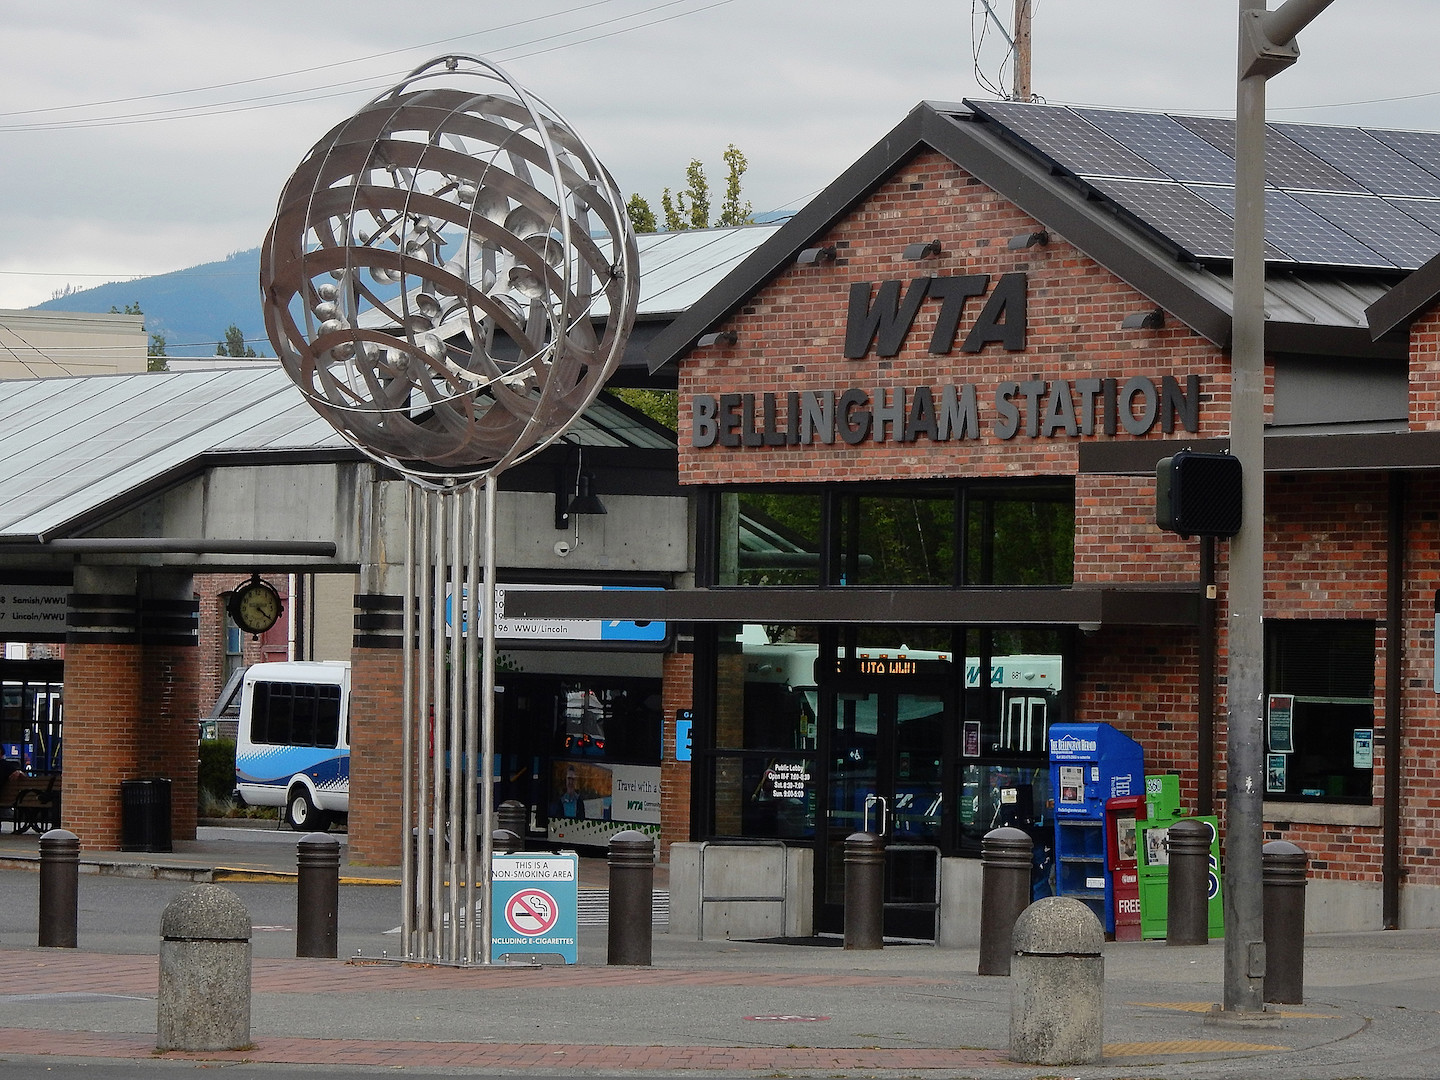
Whatcom Transit Authority bus depot on Railroad Avenue. photo: Joe Meche
by Preston L. Schiller
How Kingston Transit Doubled Its Ridership in 10 Years
Part 1
The Whatcom Transportation Authority (WTA) is a transit provider whose ridership has been stagnant or in decline in recent years after a dramatic growth of ridership between 2005 and 2009. While ridership is falling, costs are rising and cutting into funding that could go toward improving services.
More ominously, WTA’s ridership is declining dramatically when compared to the population growth rates of Bellingham and Whatcom County.
In these regards, it is not alone or unusual; most North American transit systems, large and small, are facing similar issues. Often, it is not a lack of trying, rather it is a matter of insufficient funding, lack of policy support or direction, and poor — or even counterproductive — service planning models.
WTA does many things well: its buses are clean and well-maintained, its drivers competent and courteous, its marketing and branding efforts are admirable, and it has many competent and dedicated persons on its staff. So, why is it in decline?
For this, it is necessary to understand what transit is about; what it takes to attract travelers, especially those with other options — often called “choice riders” — and how to change toward a more productive direction. Fortunately, a comparison with the dramatically improving transit system of Kingston, Ontario, can give WTA some guidance.
Anecdotal Experience
A typical day riding WTA buses in Bellingham: I’m sure the driver meant well, telling me that I should have caught the previous bus, a half-hour earlier, if I wanted to be certain to connect with my transfer downtown. I’m sure there was a reason for the five-minutes late arrival of the Route 1, scheduled to take only 11 minutes for it to reach my stop, the Fairhaven station from downtown.
Perhaps this delay was caused by having to make more boarding stops on the earlier run from Fairhaven to downtown? Perhaps it was caused by traffic delays downtown or that WTA buses are unable to change the lights from red to green at the many downtown traffic signals that slow buses — as some transit priority savvy systems do? Perhaps it was delay due to waiting for another bus arriving late to downtown with a passenger who needed to transfer to Route 1 to Fairhaven?
Or perhaps it was due to the nature of WTA’s route structure; a system overly dependent on having too many infrequent routes making tightly timed transfers downtown? No matter the cause, I was feeling anxious about making the connection for a medical appointment that had not been easy to book. If I missed the connection, there would be a long wait for the next bus, I would be late and I might have to wait hours at the medical office to be squeezed into their busy schedule or even weeks for another appointment.
Luckily, there were relatively few boardings or other delays between Fairhaven and downtown on that run; I jumped off the Route 1 and jumped onto my connecting bus and got to my appointment on time.
Cities and Rural Areas
In both cities and rural areas, public transportation may be one of the only mobility options for portions of the population economically disadvantaged or physically challenged. It can ease chauffeuring pressures for parents and help youth develop their ability to get around to activities and friends without helicoptering parents or GPS. Even the walk to and from the bus stop has been shown to be a health-beneficial activity.
Transit, when done well, can help cities of all sizes manage their growth and traffic. Well-functioning transit can deliver large numbers of persons to important destinations from downtowns to medical and educational facilities and entertainment and sports venues in ways that reduce rather than increase traffic.
When done well, transit can offer an environmentally helpful alternative to driving and complement urban planning efforts to concentrate and intensify development. If transit is an option for many trips, it can save money by reducing the need to own or operate a motor vehicle — or multiple motor vehicles, as is the case in many households.
Transit can save money for city governments and businesses by reducing the amounts of parking at important destinations. When well-utilized, transit can play an environmental role in reducing emissions and other serious problems, such as water pollution from road and parking area runoff.
Many residents resist the densification of their neighborhoods, even contesting accessory dwelling units (ADU), a relatively easy way of modestly increasing density and helping to justify better transit service. Done poorly, densification can lead to more traffic densification. When done thoughtfully, and with good transit support, people densification can succeed in neighborhood improvement with little or no increase in traffic.
Why Compare WTA With Kingston Transit?
Comparing entities that appear similar in several domains (demographics, size, setting, situation, etc.), but differ strikingly in a few, often illuminates how change might occur. Kingston, Ontario, is a city with a 2017 population of 124,454. This figure is larger than the actual urban population due to the forced amalgamation of Ontario cities with their surrounding suburbs, hamlets and rural areas in the 1990s.
Kingston Transit (KT) does not try to serve outlying hamlets or rural areas with regular service; its 2015 service area population was 121,133. Its largest employers are in the public sector: Queen’s University (including its medical school and health sciences programs), Kingston General Hospital and its affiliated medical centers, a Canadian Forces Base, St. Lawrence College, the Royal Military College, and a number of governmental agencies (federal, provincial, regional and local).
The core of Kingston consists of a well-defined central business district (CBD) and a number of older neighborhoods beyond which there is a variety of development patterns, including quite a few cul-de-sac and large-lot neighborhoods with streets poorly connected to major arterials, making transit connections difficult. Commercial developments range from large to small well-defined office and shopping centers to poorly connected strip-style developments scattered around the city.
This leaves Kingston Transit with a mix, ranging from easy-to-serve to hard-to-serve neighborhoods and commercial areas. When one excludes the suburban, hamlet and rural areas, the population of Kingston probably approaches that of the city of Bellingham. Kingston’s population growth, both for the city and its region, is quite small at about 0.4 per cent in recent years, quite a bit lower than that of its region or province as a whole.
Bellingham, Washington, has a much smaller and more defined urban boundary and a 2017 population of 89,045 with one of the fastest rates of growth in recent years in the state, currently at 2.4 per cent. By the end of 2019, its population will likely exceed 90,000.
WTA defines it service area as the whole of Whatcom County, whose population is 225,685. Its effective service area population is likely much smaller; many rural areas and hamlets are quite remote from any regular or on-demand transit service. The overwhelming majority of transit riders, and revenues, in Whatcom County come from Bellingham, and the overwhelming majority of Kingston riders come from within the more urban parts of Kingston — thus making for their comparability in a number of regards.
Service Area, Revenue and Cost Factors
When WTA and KT are compared in terms of several revenue and cost factors, there are both convergences as well as several striking differences. WTA’s income derived from the farebox (cash collection as well as passes) is considerably lower (8 per cent) than that of KT (37 per cent). This translates into a much lower public subsidy per ride for KT (U.S. $2.17) than the public subsidy per ride for WTA ($3.85).
Despite WTA’s somewhat lower fare and monthly pass fees compared to those charged to KT riders and pass holders, WTA has not been increasing riders or monthly fee passholders overall. Aggressive marketing, policy, and some major employer support, as well as modifying some services to better serve large employment facilities, have led to a robust enrollment of monthly pass purchasers for KT.
The lower public subsidies for KT rides demonstrates the power of greater ridership, and, possibly, much greater efficiency in planning, administration and operations — more riders equals more revenues and lower subsidies (see above table and two charts on page 6).
Another interesting point of comparison is that other data (not shown here) indicates that KT operates more hours per day and logs considerably more service miles than does WTA. That the total operating costs for fixed (regular) route services are virtually equal indicates that KT is able to carry many more riders more miles with longer hours of operation and support a bus fleet a little larger than WTA’s at no more total cost. (see above table)
WTA: From Rapid Growth to Decline
WTA had very low ridership during the 1990s and early 2000s, when it prided itself on being “the service for the transit dependent.” In 2004, it undertook a strategic planning effort that involved many of its staff, past and current elected officials, and numerous concerned citizens, including WWU students.
Several of those involved, who were not WTA staff, advocated for reconsidering the pulse system and replacing much of it with a frequent service approach. The staff and their principal consultant equivocated, citing the advantages of the pulse-radial system for greater geographic coverage and downplaying the proven ridership attracting power of increasing service frequency.
The result was a compromise: WTA would largely hold onto the pulse-radial system with a few changes — 1) it would establish a transfer subcenter at Cordata Station, truncating some of the county services and and making transfers to a more frequent service possible; and 2) corridors of increased frequency, labeled “GO Lines,” were created.
At present there are four color-coded GO Lines: Blue (Routes 105, 107, 108, 190, 196), Green (Route 232), Gold (Route 331) and Plum (Routes 512, 525, 533, 540). A couple of these lines were routes whose frequency was boosted, others were formed by yoking together two or more routes into sharing a corridor for part of their routing, calling the shared segments GO Lines.
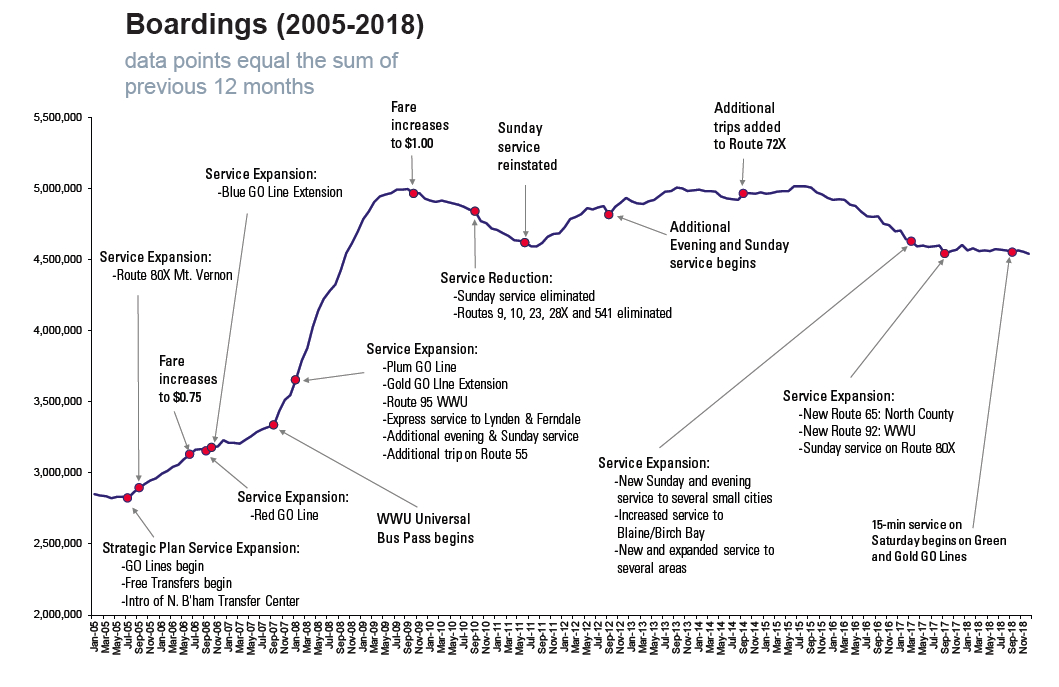
The WTA bus ridership timeline, from a WTA report, tracks and annotates WTA’s regular route ridership performance between January 2005 and November 2018. Overall, it demonstrates how ridership climbed steeply upward shortly after the 2004 Strategic Plan was completed: the Cordata Transfer Center was opened, the express bus service linking Bellingham to Mount Vernon and Everett started (more on this in Part 2), free transfers and the first GO Lines began.
Following the fare increase of 2006, a small decline ensued, which is generally the case when fares increase. A steep and positive climb recurred in late 2006 and early 2007 when some GO Line service expanded. The upward climb became even steeper in 2008 with several service expansions and WWU students voting to add a fee to support a universal bus pass.
Ridership peaked and then trended negatively in mid-2009 for several reasons. The WTA bus ridership timeline indicates the fare increase but does not mention WTA’s cessation of transfers, nor the dispiriting effect of the defeat of the countywide sales tax levy increase, which passed in Bellingham but was defeated in the rest of Whatcom County — aided by Lynden’s elected officials voting to oppose it.
Also left out of the WTA bus ridership timeline is the economic recession which triggered WTA’s extreme sensitivity to downturns in sales tax revenues — which it is virtually completely dependent upon. There were other service changes, not included in the timeline, which probably reduced WTA ridership, such as forcing 80X passengers headed to WWU from Mount Vernon to transfer to another bus at the Lincoln Creek park-and-ride rather than having a direct ride to campus, or the delay caused by a poorly situated and designed stop at Alger and I-5.
Service reductions in 2010, especially WTA’s cessation of Sunday service, further deepened its decline. When Sunday service was reinstated in mid-2011, thanks to funding from a citizen-led city of Bellingham Transportation Benefit District (TBD) initiative — not mentioned in the timeline’s annotation, the ridership curve changed direction and was further stimulated by additional evening and Sunday service in 2012 and 2014.
The service increases were aided by an improving economic environment leading to sales tax revenue gains. From mid-2014 to mid-2015, ridership continued to increase, although at a very moderate pace. Beginning in mid-2015, WTA entered into a period of ridership decline which persists to the present, despite economic and population growth.
Kingston Transit’s Transformation
During the same time frame that WTA’s ridership peaked, declined, peaked again, and then entered its current decline, KT was beginning the process that led to a dramatic and persistent increase of ridership. The transformation of KT from lackluster to leader in ridership gain involved numerous factors which will be described in greater detail in Part 2 of this article in the next issue of Whatcom Watch.
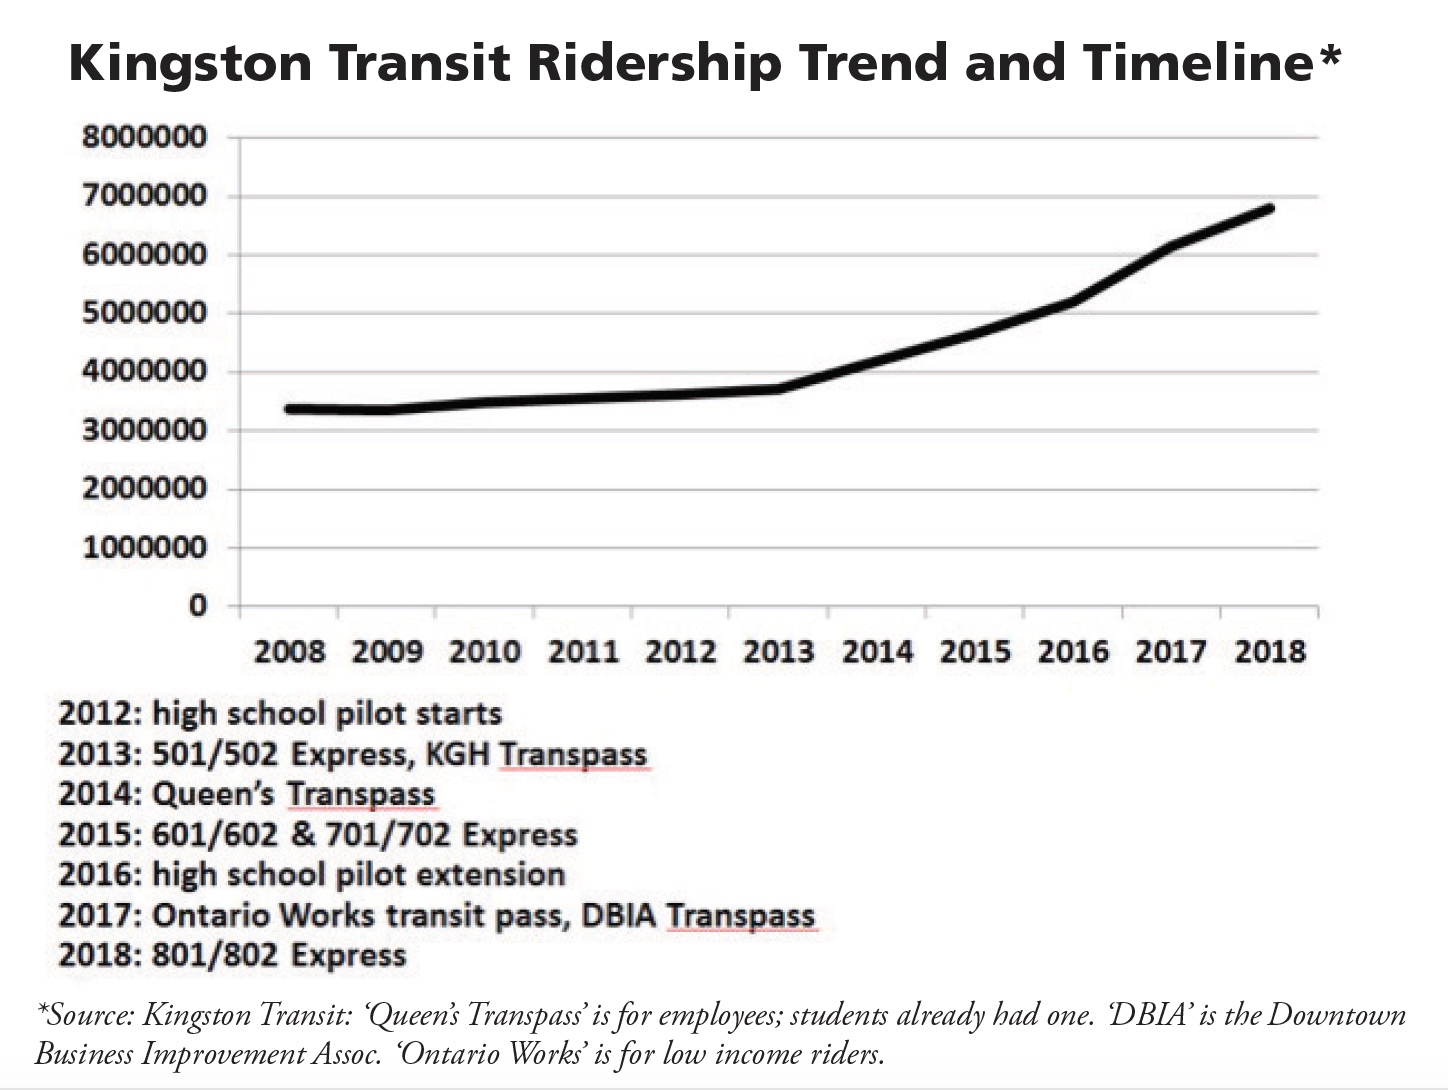
The major factors in this transformation were policy-driven decisions; enhanced funding; changing KT’s service model away from a business-as-usual (BAU) approach toward innovative planning and provision; aggressive marketing — especially around transit passes; and the introduction of four frequent express routes providing speedier and more direct and comprehensive citywide coverage between 2013 to 2018. KT Ridership Trend and Timeline on page 7 charts KT’s ridership trend, as well as presenting a timeline of a few of its most important changes.
There are several ways transit agencies measure their productivity and market penetration. Three of the more common ones are: total ridership; per capita ridership for their service area; and whether the trend line is stagnant, positive or negative. Some agencies, such as WTA, often measure the passenger miles (or kilometers) per rider per year. This metric has been omitted here for reasons that will be more fully explained in Part 2; it can often mislead the assessment of whether a service is moving in the best direction for its overall mission.

Per capita ridership has been included in Year-to-Year Ridership and Change: WTA vs. KT table because it indicates whether a service is effectively penetrating its service area population; whether it is, in fact, attracting riders who choose it over their private vehicles for some trips.
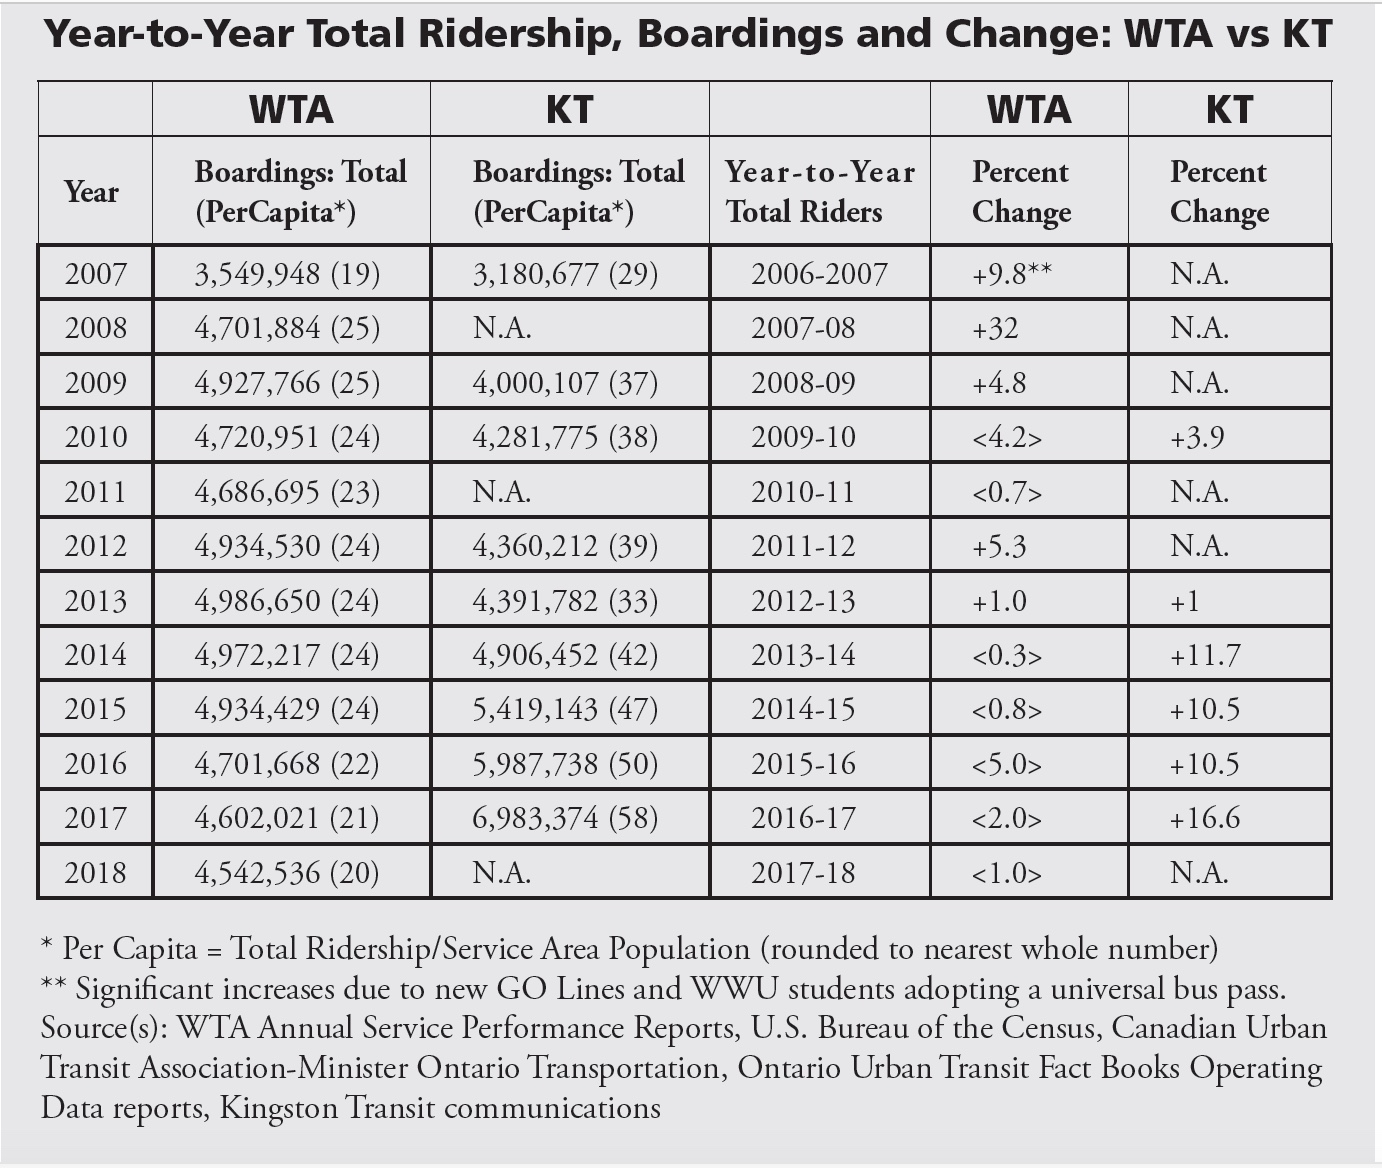
The Year-to-Year Ridership and Change: WTA vs. KT table demonstrates that KT started the years presented with a lower total ridership, although higher per capita ridership, than WTA. When WTA began its total ridership increase, it improved its per capita ridership as well, but declined back toward its 2007 level by 2018. KT increased its per capita ridership dramatically between 2008 and 2018, consistent with its large increases in total ridership.
The many reasons for such stark differences, as well as discussions of how KT succeeded in its transformation and ideas for how WTA could begin to transform itself, and, once again, grow its ridership will be the stuff of Part 2 of this article.
Next Month: Part 2
Why governance, organizational and route structures are so important in growing transit.
___________________________
Preston L. Schiller is the principal co-author of “An Introduction to Sustainable Transportation: Policy, Planning and Implementation, 2nd ed. revised,” 2017. In the early 2000s he led an exchange between Bellingham and Boulder (CO) around transportation and transit issues that helped foster creating Bellingham’s Transportation Commission. He teaches in the University of Washington’s Civil and Environmental Engineering’s Sustainable Transportation Master’s program and has taught transportation planning at WWU’s Huxley College and Queen’s University (Kingston, ON). He led the preliminary research and planning that created the express bus routes connecting Bellingham, Mount Vernon and Everett. His prior articles about WTA can be found by an author search at whatcomwatch.org; recent as well as previous issues Jan. 2002 to Sept. 2015.