
Pros and Cons of Metering Local Ag Water Use
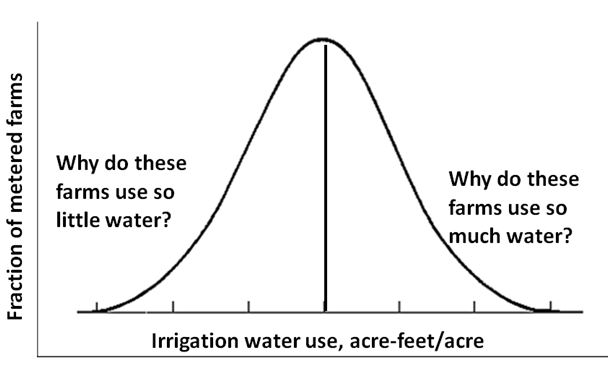
Fig. 1. Hypothetical distribution of water use for a particular crop. Interviews with those famers on the right would show what factors account for their higher than average water use and suggest ways to reduce that water use. Interviews with those on the left would show what factors account for their efficiency, which could help other farmers reduce their water use.
by Eric Hirst
During the critical summer months of July, August, and September, when stream flows are low and water temperatures high, agriculture (especially irrigation) accounts for almost two thirds of Whatcom County’s water use.1
Almost all residential,2 commercial, and industrial water use is metered and recorded monthly. Indeed, state law requires that all utilities meter their customers.3 According to the Washington Dept. of Health, “Installing meters is the most important step you can take to establish an effective WUE [Water Use Efficiency] program…. Once customers realize how much water they are using, water demand tends to decrease.”4
It seems reasonable to extend this metering requirement to all water users, not just utility customers. It seems especially appropriate to meter and report on agricultural water use because agriculture is — by far — the largest water user in the county.5
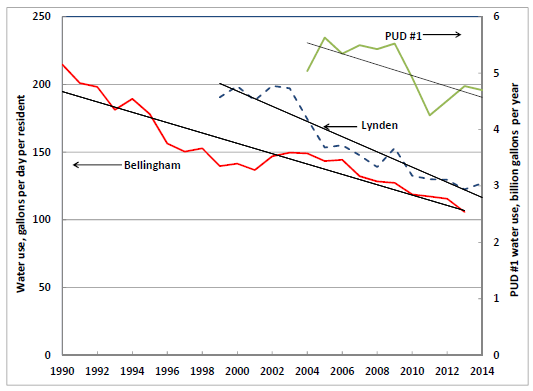
Fig. 2. Long-term trends in Bellingham and Lynden water use (residential, commercial, and industrial). For both cities, the total amount of water used per resident has been declining for at least 15 years. The chart also shows a similar trend in water use for PUD #1. It is not possible to make a similar statement about agriculture because most agricultural water is not metered.
Whether the benefits of metering exceed the costs depends on one’s perspective and time horizon. I think the benefits are likely to be substantial, which is why I encourage Whatcom farmers to install water meters and automated-meter-reading (AMR) systems on some farms. I propose the use of AMR, rather than manual, systems to minimize meter-reading errors. Farmers (like all human beings) are busy and are likely to read their meters erratically and inaccurately. In some cases, farmers might intentionally misreport their water use if they are concerned about:
- relinquishment (in which case they might report more water use than the actual), or
- water use that is not fully permitted (in which case they might report less water use than the actual).
AMR eliminates these potential problems and ensures data accuracy.
I also suggest AMR systems because their costs have dropped dramatically and their performance has improved substantially over the past few decades. Even small water districts and associations now use AMR systems. The days when a meter reader walked down a driveway, read the meter, and recorded the number on a sheet of paper are long gone.
Metering costs include the meter itself, meter installation, the sending unit, and the AMR system. I communicated with many people from local water utilities, agricultural-equipment suppliers, meter manufacturers and wholesalers to develop cost estimates; see sidebar for more detail.6 Overall, a system that can handle 450 gallons/minute (gpm) costs about $2,000, and a system that can handle 1,000 gpm costs about $3,000.
Meter And AMR Benefits
Is it worth $3,000 to meter water use for a large irrigation pump? The answer depends on the benefits of the data the meters provide. If farmers decide to meter their water use, they will devote money and time during the first year to decide on the kinds of metering systems to install, the types of farms (e.g., raspberries, blueberries, and/or dairies) to meter, and how many systems to meter. During this period, they will enjoy no benefits from this effort. During the following years, as data are collected, recorded, and analyzed, benefits will accrue:
Baseline data on actual water use: At present, estimates of annual and monthly water use by type of crop are based on the Washington Irrigation Guide.7 Because the guide is based on data from 1985 and 1992, “much of our understanding of how the old WIG was developed has been lost to time.… [M]uch of the actual data have been lost and the institutional memory of how it was developed is no longer available ….”8 The new WIG, expected to be issued within the next few years, will contain data on more crops and many more weather stations. In the meantime (and perhaps indefinitely), metered data on actual water use will improve our knowledge about when and for what purposes Whatcom County agriculture uses water.
Differences among farms and farmers: Local farmers will learn more about their actual water use and variations in monthly and annual water use per acre (and, more important, the factors that account for this variation); see Fig. 1. Over time it would be possible to examine year-to-year variations and analyze these changes relative to weather conditions (e.g., summer temperatures, humidity, wind speed, and rainfall); it might be possible to use this data to predict and plan future water use as a function of weather forecasts.
Quantification of tribal water rights: These data will be crucial in negotiations with the Lummi Nation and the Nooksack Indian Tribe (along with the U.S. Depts. of Interior and Justice, the state Dept. of Ecology, and other local water users). A key issue in these negotiations will be the amount of water that must remain in the three forks and the main stem of the Nooksack River and its tributaries. Other water users, including the cities, water districts, water associations and PUD #1 will bring to the table detailed data on how and when they use water, for each customer class. They will use these data to document their actual beneficial use, which will help in defending their rights to the water they use and need (Fig. 2). And what will the farmers be able to bring to the table? Absent data, the answer is very little. Agricultural users who cannot document the amount of water they actually use will be disadvantaged in an adjudication of water rights.
Illegal water use: A similar situation will arise when Ecology and others deal with illegal water use in Whatcom County.9 Here, too, data on actual water consumption will be needed to help those farmers who are now using water without a valid permit (or, in some cases, without any permit at all) gain access to legal water. Water-use data from those farmers with water rights will help Ecology determine whether and how much additional water is available for those farmers without such rights.
Expanding water supplies: The Abbotsford-Sumas aquifer might be able to provide an ample supply of groundwater for agriculture in a way that improves instream flows.10 Detailed groundwater modeling is underway that, if and when completed, will enable determination of the effects of individual wells on nearby wells and on instream flows.11 Detailed data on actual water use will be needed as inputs to this modeling effort to determine where, when, and how much water can be pumped without adverse environmental effects.
A Way Forward
I suggest that one or more of the local watershed improvement districts meter 50 to 100 water pumps. Selection of these sites should be based on crops that are water-intensive or grown on a significant portion of the Whatcom County farm acreage. Focusing on one or two crops would allow farmers to determine (1) how challenging it is to install and pay for meters and (2) how useful the meter data are.
A useful way to start this process would be to hire an engineer to conduct on-site inspections of several (say 20 to 30) farms to determine how much it would cost to install meters at each location. Spending several thousand dollars on such a preliminary study would show, more accurately than this paper could, the costs to meter agricultural water use and the variation from farm to farm in these costs.
Summary
The cost to meter agricultural water use is $2,000 to $3,000 or more per meter point. Whether the benefits outweigh the costs depends on one’s view of the long-term water problems facing farmers, including replacement of assumptions on typical water use by month and type of crop with real data, quantification of Native American rights to instream flows, resolution of unpermitted water use, and possible increases in groundwater use instead of surface-water diversions. Finally, metering water use may be a small price to pay for the right to use a public resource for personal gain, a price that almost all other water users now pay.
Meter and AMR Costs
During peak summer months, water flows through irrigation pumps at rates of up to 1,000 gpm. So I studied 3” and 4” meters, which can handle flows of 450 and 1,000 gpm, respectively. By comparison, a typical household might use only 0.14 gpm. The cost for a 4” meter is about $1,250 plus another $1,200 for installation.
The sending unit, mounted on top of the meter, costs $250. This unit communicates with and is the first element of an AMR system.
The capital cost for the driveby systems often used by rural systems is about $10,000 for the software, receiving unit and laptop computer. The vehicle can travel at up to 40 mph and read meters from a distance of up to 0.5 mile. These systems are independent of the meter capacity and the number of meters to be read. For example, if farmers install meters on 100 irrigation pumps, the AMR cost per meter is only $100.
An alternative to buying the meter-reading equipment and software is to hire a firm to read, record, and report meter readings. Several small Whatcom County water associations do just that. It might take one person one day to drive around the county to read ~100 agricultural meters, at a cost of $200/day. The annual cost for meter reading would be $16/meter if irrigation meters are read once a month from April through October.
Endnotes
1. E. Hirst, http://lwvbellinghamwhatcom.org, Whatcom Water Problems and Possible Solutions, May 2015.
2. Rural homes that draw water from permit-exempt wells generally do not have water meters.
3. In 2003, the Washington State Legislature passed the Municipal Water Law, which requires utilities to install meters for all their customers by January 2017.
4. Washington Dept. of Health, Water Use Efficiency Guidebook, Third Ed., June 2011.
5. State law (RCW 90.03.360) requires that all surface water diversions be metered “to permit accurate measurement and practical regulation of the flow of water diverted.” Under RCW 90.44.445 Ecology “may require withdrawals of groundwater to be metered … for a new water right permit.” It is hard to see why this requirement should not apply to all groundwater withdrawals.
6. E. Hirst, Metering Agricultural Water Use in Whatcom County, Sept. 1, 2015.
7. U.S. Dept of Agriculture, Natural Resources Conservation Service, Washington Irrigation Guide.
8. Washington Dept. of Ecology, Updating the Washington Irrigation Guide, Jan. 2012.
9. The draft 2016 Whatcom County Comprehensive Plan (proposed Policy 8A-2-10 in Chapter 8 on Resource Lands) calls for “Securing an adequate, sustainable and legal supply of irrigation water to support the long-term viability of the local agricultural industry.”
10. S. Bedlington, M. Maberry, and E. Blok, “Water management complexities start in Canada,” The Bellingham Herald, B4, Aug. 8, 2015.
11. G. Stoyka and C. Lindsay, “Project Overview Development of a Numerical Groundwater Model for the Lynden/Everson/Nooksack/Sumas (LENS) Area of Whatcom County,” presentation to WRIA 1 Planning Unit, Dec. 17, 2014.